Unraveling Market Volatility with Bollinger Bands
In the ever-changing world of financial markets, traders and investors are in constant pursuit of tools and strategies to navigate the turbulent seas of price fluctuations. One tool that has gained increasing prominence in recent years is the Bollinger Band. In this blog post, we will delve into the world of Bollinger Bands, shedding light on their significance and how they can assist traders in making well-informed decisions on XCMarket.com.
Understanding Bollinger Bands:
John Bollinger introduced Bollinger Bands in the 1980s as a technical analysis tool to gauge the price volatility of a financial instrument. These bands comprise three key lines that are plotted on a price chart:
-
The Middle Band: This represents a simple moving average (SMA) of the asset's price over a specified period, often set at 20 periods.
-
The Upper Band: Positioned above the middle band, this line reflects the standard deviation of the price data from the middle band, typically multiplied by a factor of 2.
-
The Lower Band: Situated below the middle band, this line mirrors the standard deviation in the opposite direction.
Bollinger Bands offer versatility, providing valuable insights into an asset's trend and volatility. Traders harness this tool to pinpoint potential price reversals, overbought or oversold conditions, and the likelihood of an impending breakout.
Leveraging Bollinger Bands in Trading:
-
Assessing Price Volatility: Expanding bands signify heightened price volatility, indicating potential trading opportunities. Conversely, when the bands contract, it implies lower volatility and a probable consolidation phase.
-
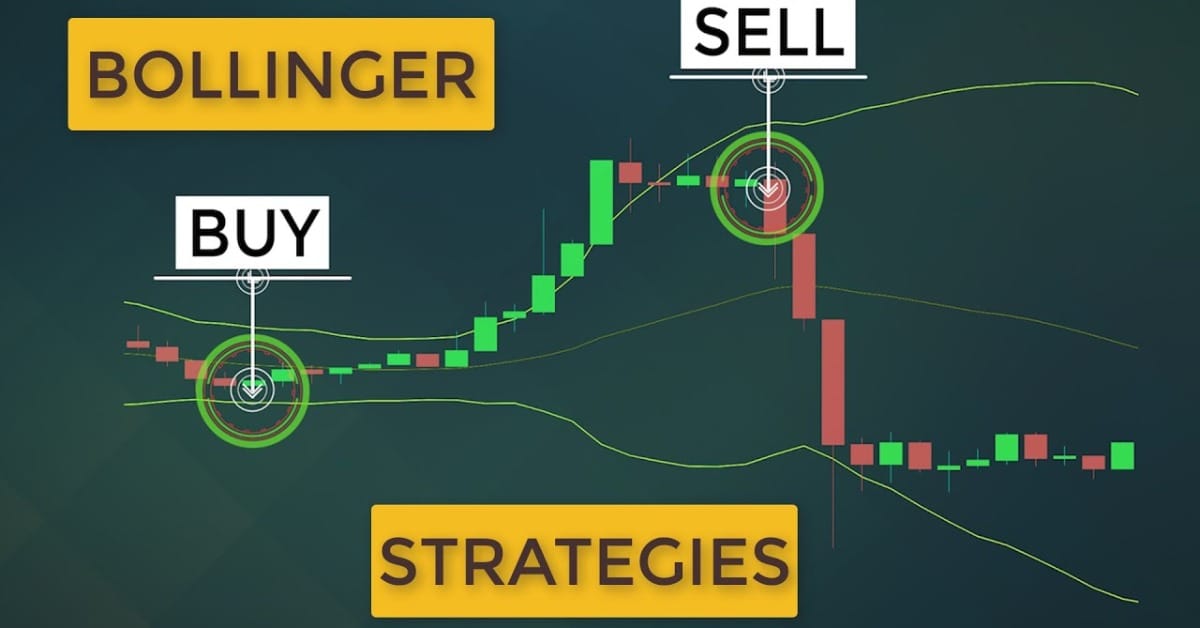
Spotting Overbought and Oversold Conditions: When the price approaches or touches the upper band, it might indicate that the asset is overbought, possibly signaling a pending reversal. Conversely, if the price nears or touches the lower band, it could signify oversold conditions and a potential upward reversal.
-
Detecting Potential Breakouts: Bollinger Bands are particularly valuable for identifying potential breakouts. A breakout occurs when the price moves outside of the bands, and traders often view these breakouts as entry or exit points.
-
Confirming Trend Strength: The direction and slope of the middle band can help traders confirm the prevailing trend. An upward-sloping middle band typically suggests an uptrend, while a downward slope indicates a downtrend.
Real-Life Application:
Consider you're trading on XCMarket.com, and you observe that the Bollinger Bands of a specific stock are contracting, indicating reduced volatility. In such cases, exercising caution and awaiting a breakout before initiating a trade could be a prudent strategy.
Conversely, when you notice a stock approaching the upper Bollinger Band, it may be a suitable moment to contemplate taking profits or considering a short position. Always bear in mind that Bollinger Bands work best when used in conjunction with other technical and fundamental analysis tools.
Conclusion:
Bollinger Bands serve as a potent tool for traders and investors seeking to evaluate price volatility and make informed decisions in the financial markets. Whether you're a seasoned trader or a novice embarking on your trading journey, incorporating Bollinger Bands into your strategy can empower you with a deeper understanding of market dynamics and potentially enhance your trading outcomes.
Keep in mind that, like any tool in your trading arsenal, Bollinger Bands are most effective when employed alongside other forms of analysis and risk management strategies. XCMarket.com provides a dynamic platform where you can apply these techniques in real-time, making it an ideal place to put your knowledge to the test.
Start exploring the potential of Bollinger Bands on XCMarket.com today and witness how this versatile tool can enrich your trading experience.